Enterprise application
Database Intelligence Agent
An AI operations assistant for SQL Server and Snowflake fleets. Ask about your fleet in plain English, get answers from the live servers, and approve every change before it runs.
In production at its first enterprise adopter.
What it does
- Plain-English troubleshooting. Ask what's blocking a server and it reads the server's own session and lock data, live: who is blocking whom, what they're waiting on, and the query text on both sides. Follow up about deadlocks, wait stats, long-running queries, Query Store, index fragmentation, tempdb or the error log in the same conversation.
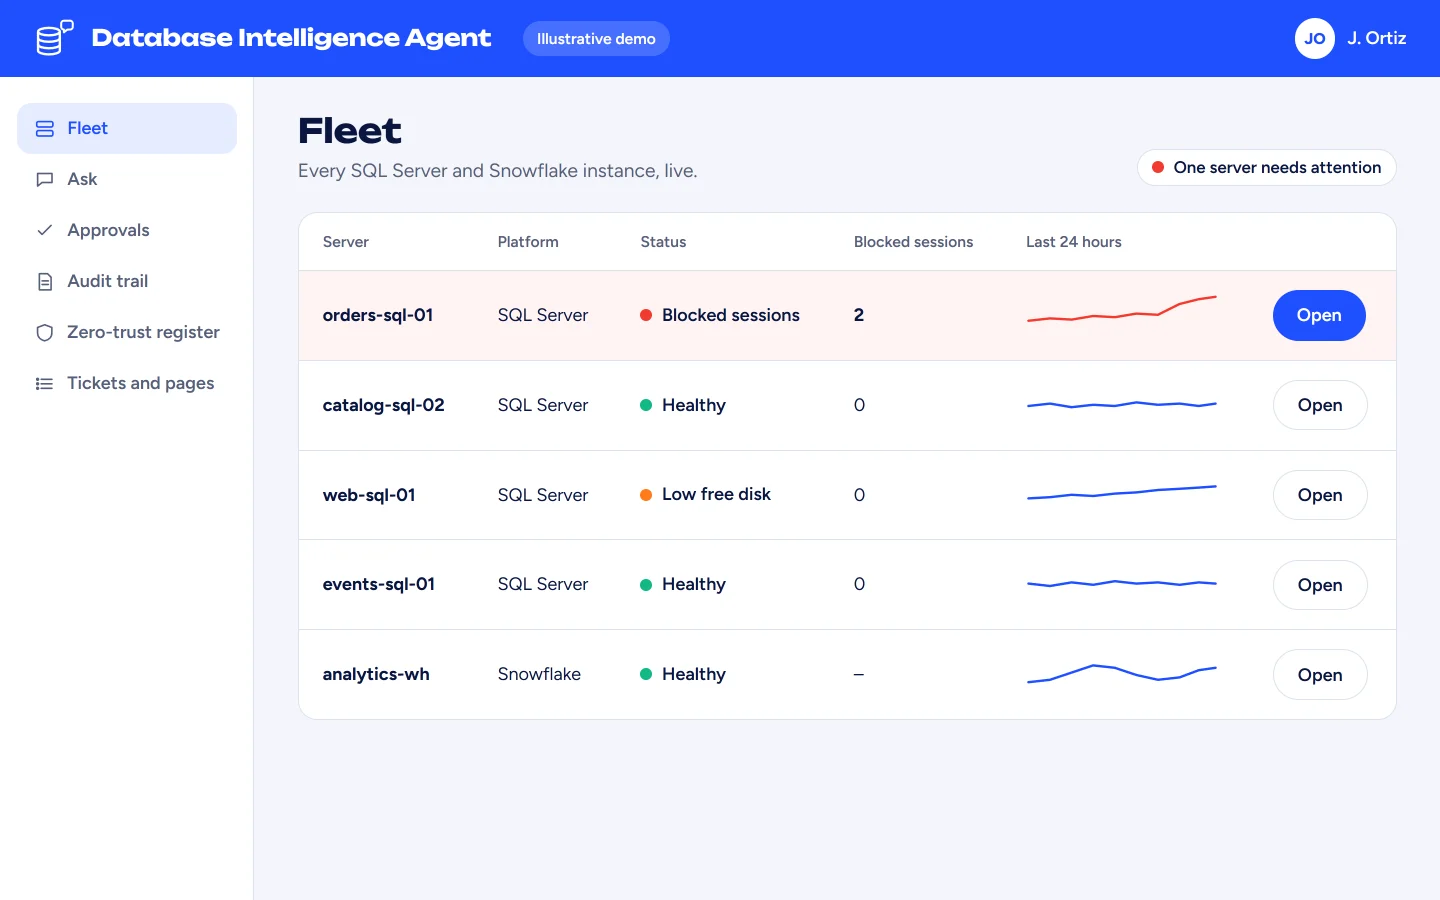
- One view of the fleet. Every SQL Server and Snowflake instance on one dashboard. Each server has its own page with live CPU, page life expectancy, blocked sessions and free disk, 24-hour trends, and one-click checks.
- One form to onboard a server. Enter the name, environment and network segment. The dashboard, the audit compliance tracker and the security register pick it up on their own, with nothing to re-enter.
- Snowflake, too. Warehouse status, credit usage, query history, storage, logins and task status, in the same conversation.
- Baselines and drift. Capture a configuration baseline, compare a server against it later, and build an incident timeline on request.
- Reports on demand or on a schedule. Health summaries, patch status, licensing, audit status and alerts by server.
Safe by design
- Every change waits for a person. Killing a session, rebuilding an index, deploying an audit: the agent proposes the change with the exact SQL, a risk level and a reason, then stops. A person approves it and runs it, and their name goes on the record.
- Roles checked on the server. Read-only users can see every server, alert and pending change, but they can't approve or run anything, from the screen or the API.
- An audit trail nobody can edit. The audit log is append-only. The database itself refuses edits and deletes.
- A zero-trust register. Each production server is checked against a set of security controls. When a control can't be met, a named person signs off the exception, and it expires on a set date.
- Governed AI. Answers come from a catalog of approved models, chosen per conversation. Every model call is logged: who asked, what was asked, what it cost and what came back.
- Single sign-on and a locked-down relay. Staff sign in with Microsoft Entra ID, and servers in separate network segments are reached through a locked-down relay agent.
Works with what you already run
- Microsoft SQL Server
- Live checks, plus SQL Server Audit deployed and managed from the app.
- Snowflake
- Warehouse, credit, query, storage, login and task checks.
- ServiceNow
- Incidents opened from the conversation, attributed to the person who asked.
- Jira
- Tickets with the findings already attached.
- Confluence
- Runbook search, with the source page cited in the answer.
- PagerDuty
- Per-server escalation policies page whoever is on call, and acknowledgments show up in real time.
- Splunk and New Relic
- Audit and error logs are written where your existing pipelines already read them.
- Microsoft Entra ID
- Single sign-on.
Set up for your environment
We set the agent up for each company rather than selling one fixed box: your servers and network segments, your sign-in, your ticketing, paging and runbook tools, your approved AI models, and your own name and colors on it.
Where the savings come from
- Most questions cost nothing to answer. Common questions are answered from a local knowledge base at no model cost. Only real reasoning goes to a paid model, and every call's cost is metered.
- Faster answers during an incident. One question replaces opening several tools and tracing sessions by hand.
- No new integration projects. Findings go straight into the ServiceNow, Jira, Confluence and PagerDuty you already pay for, and audit and error logs land where Splunk and New Relic already look.
- Onboarding without the busywork. One form covers monitoring, compliance tracking and security checks. No spreadsheets, and no second system to keep in sync.
- Audit evidence collected as you work. Every change is approved, attributed and logged, so audit prep starts from records you already have.
- Routine checks run themselves. Scheduled reports and per-server alert thresholds catch problems early and keep your DBAs on the work that needs them.
See how it works
Illustrative demo. Server names, people and data are made up.
A one-minute tour

The tour has no sound. It walks through the six steps below: the fleet dashboard, a plain-English question about blocking, the proposed fix waiting for approval, the approval and its audit record, the zero-trust register, and a ticket and page handed to the team's tools.
-
The fleet at a glance. One server shows blocked sessions. -
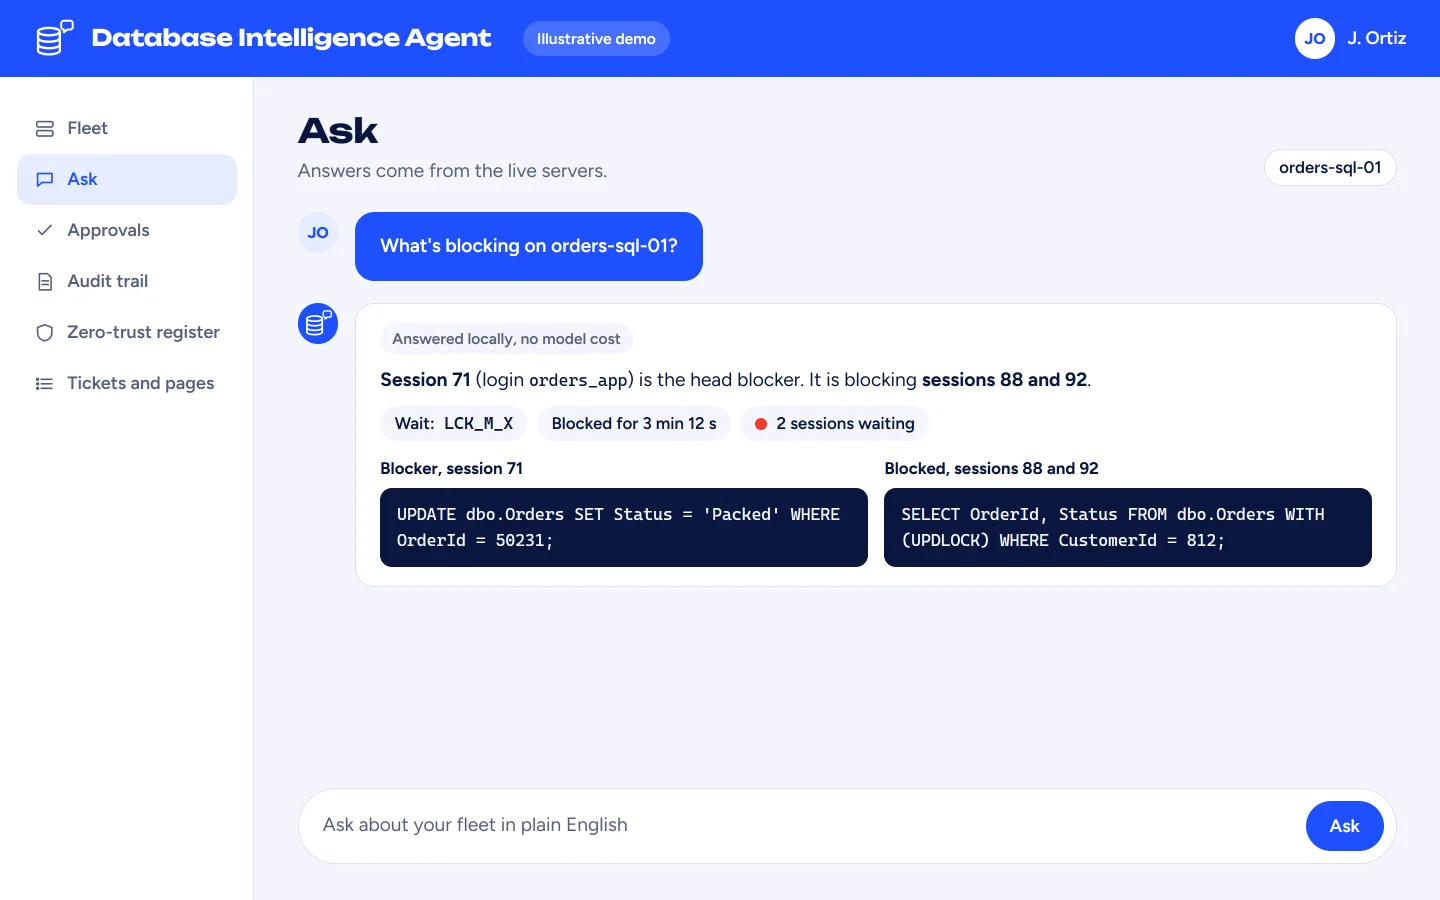
Ask in plain English. The answer comes from the live server: who is blocking whom, and the query text on both sides. -
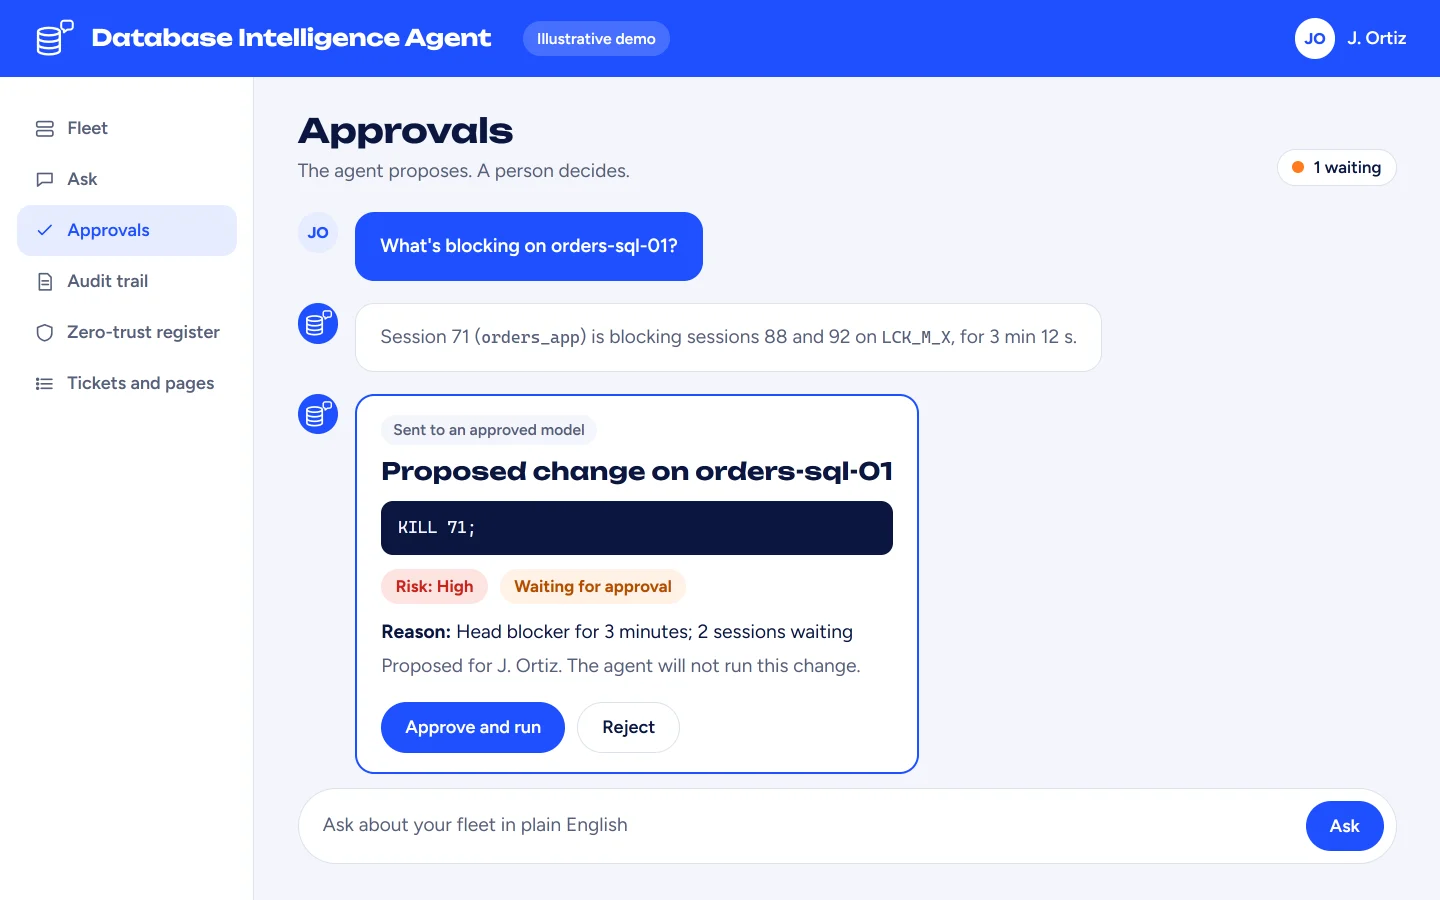
The fix waits for a person: the exact SQL, a risk level and a reason. -
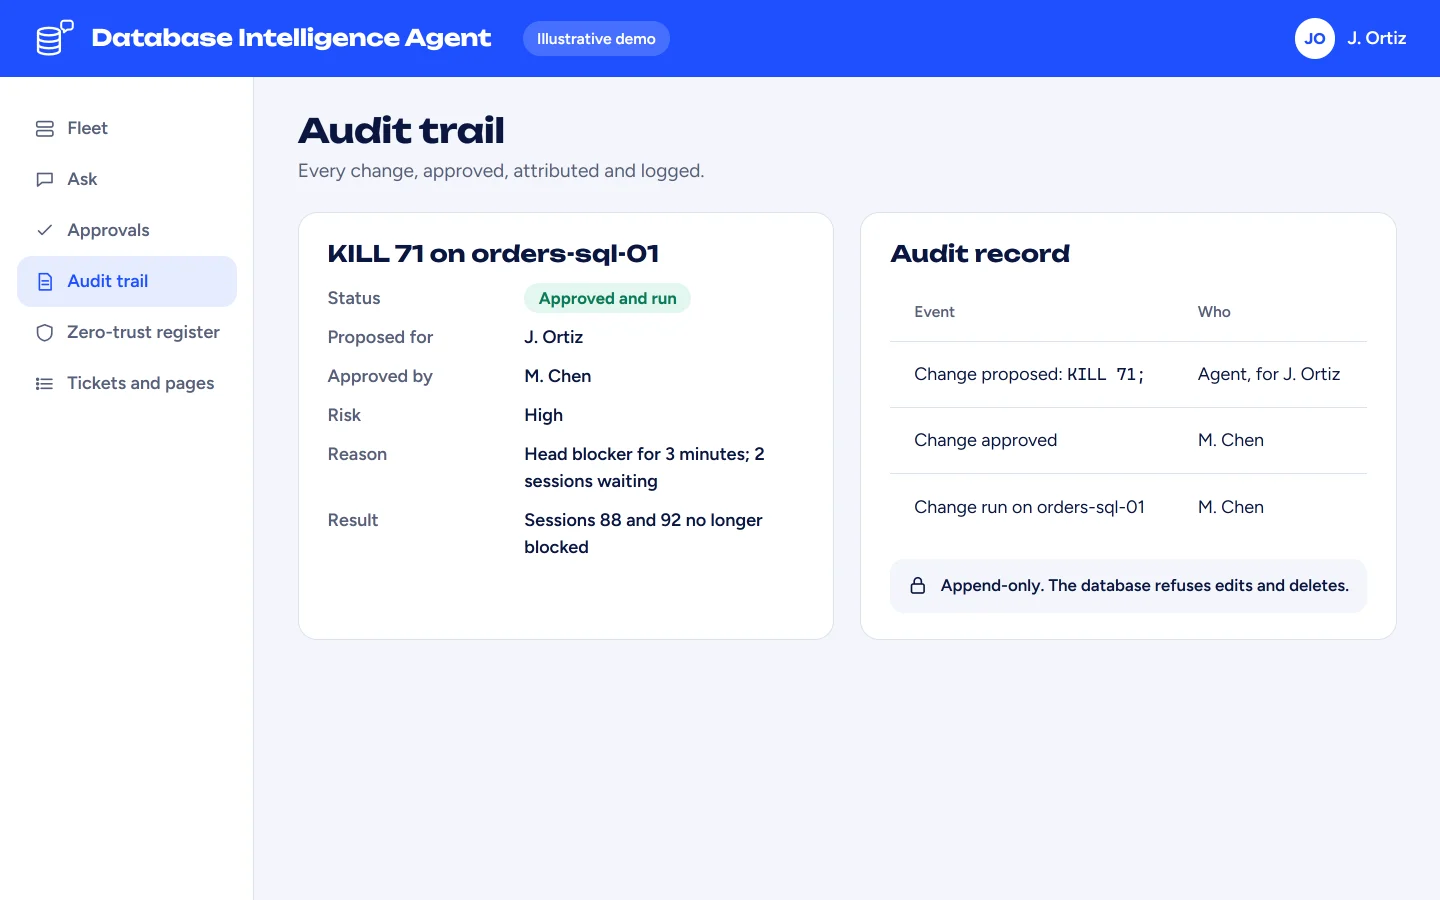
Approved, run and recorded. The audit trail can't be edited. -
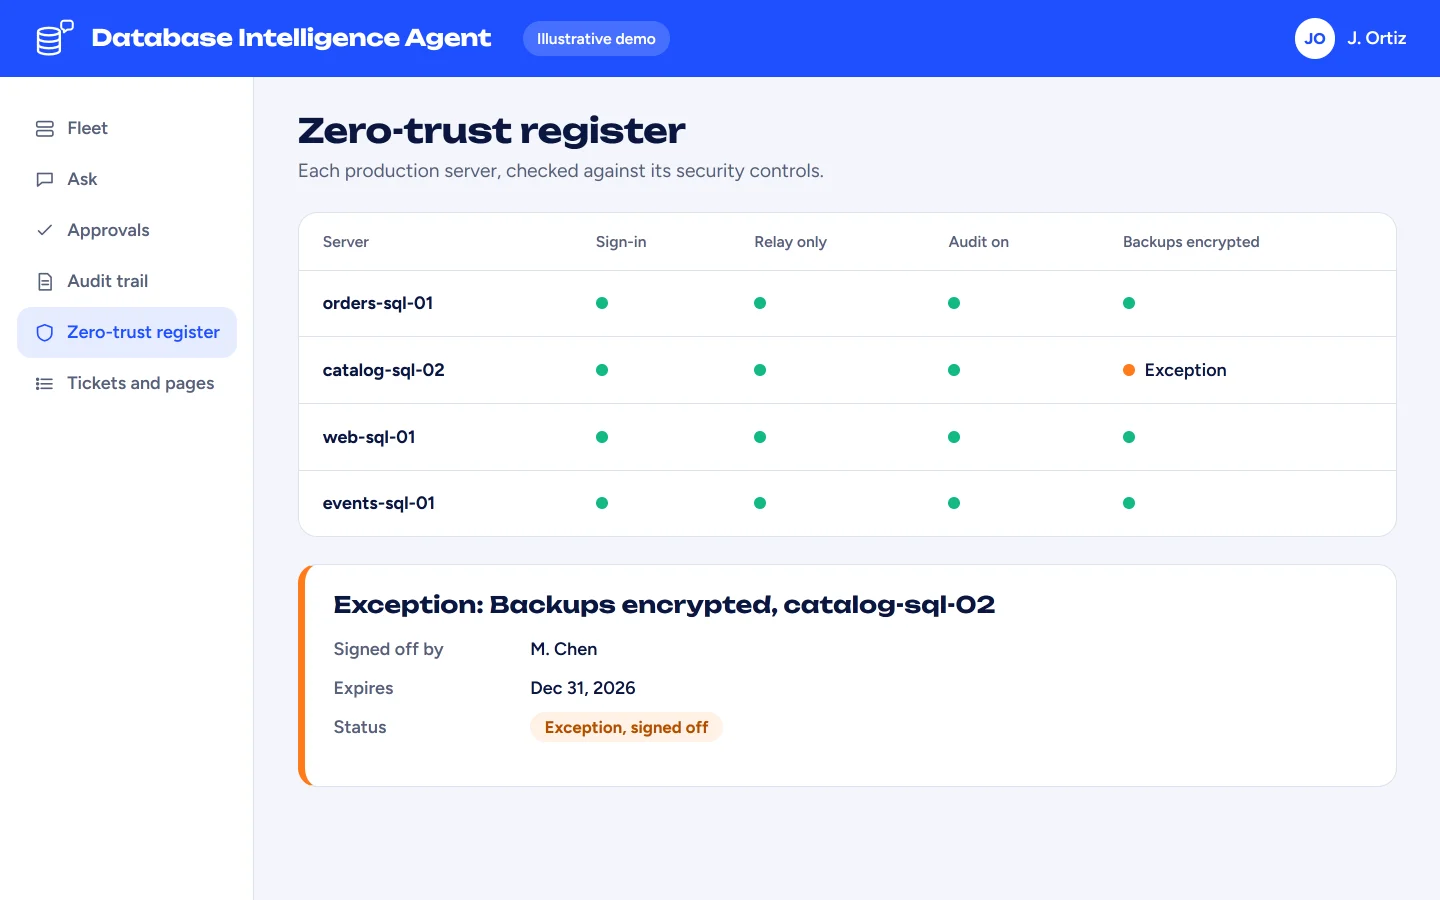
The zero-trust register. An exception, signed off, with an expiry date. -
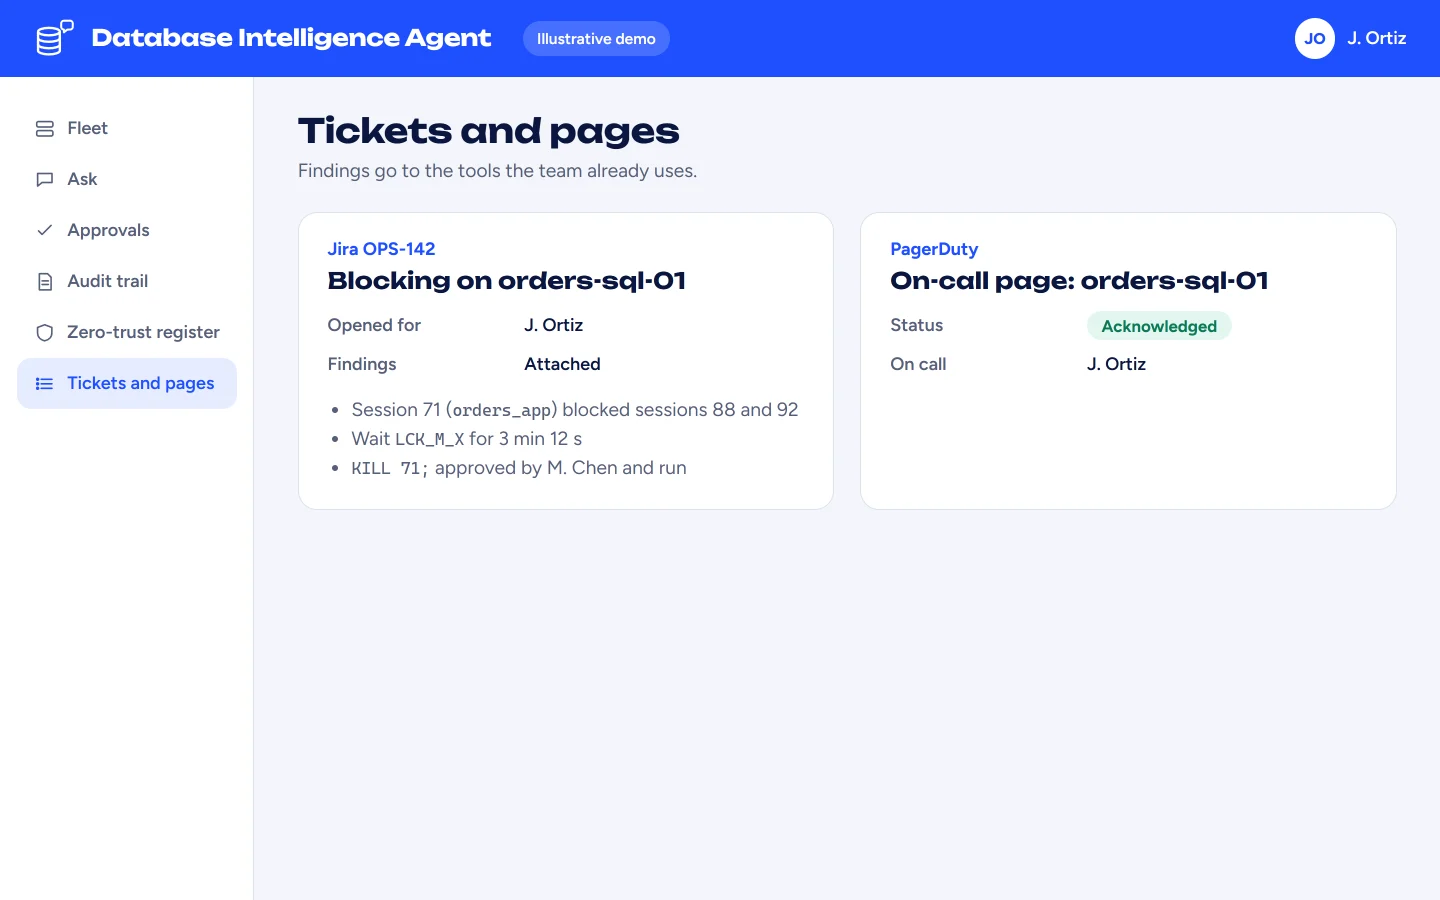
Handed to the team's tools: a Jira ticket with the findings, and the on-call page acknowledged.
Want it on your servers?
We set it up for your environment, from sign-in to paging. Email [email protected] or send a message. A person reads every one.